Project Overview
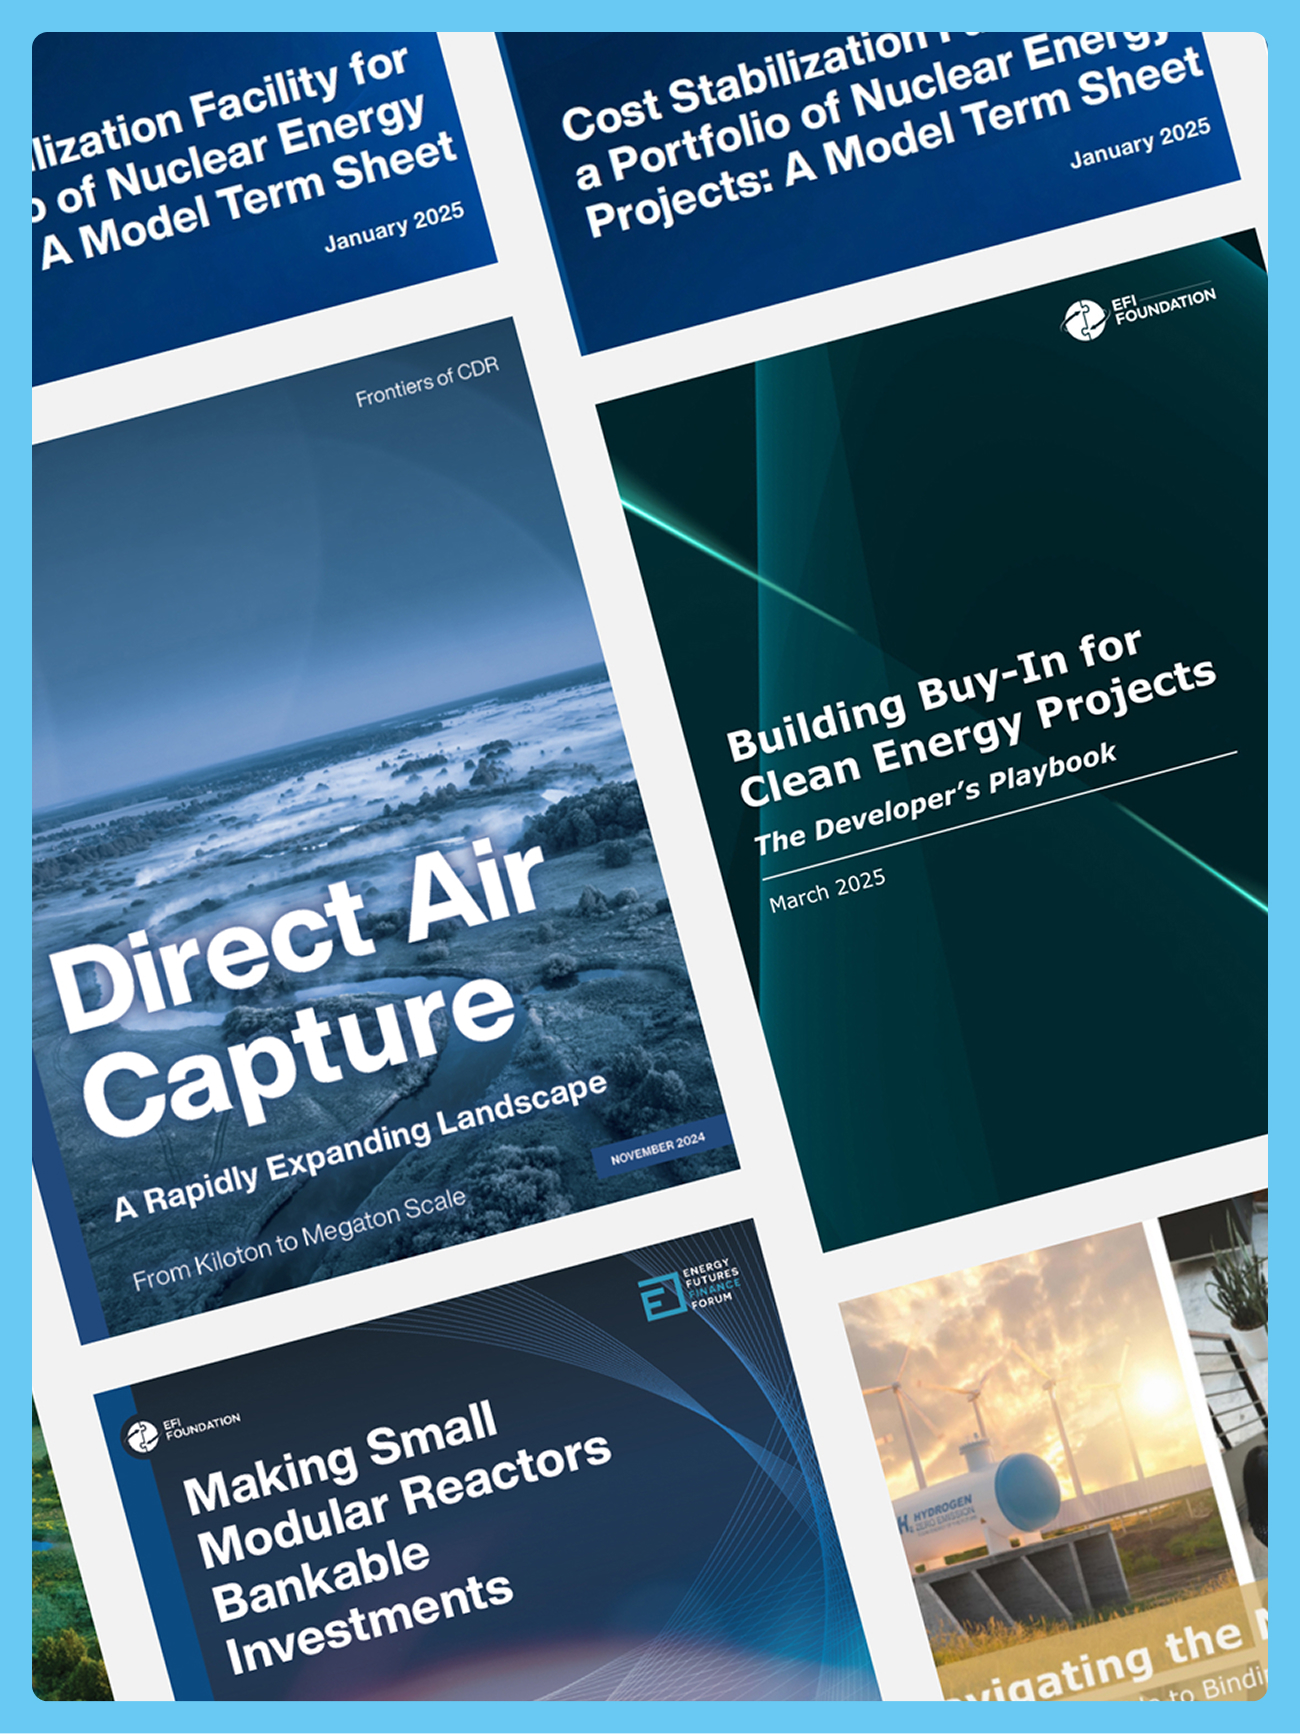
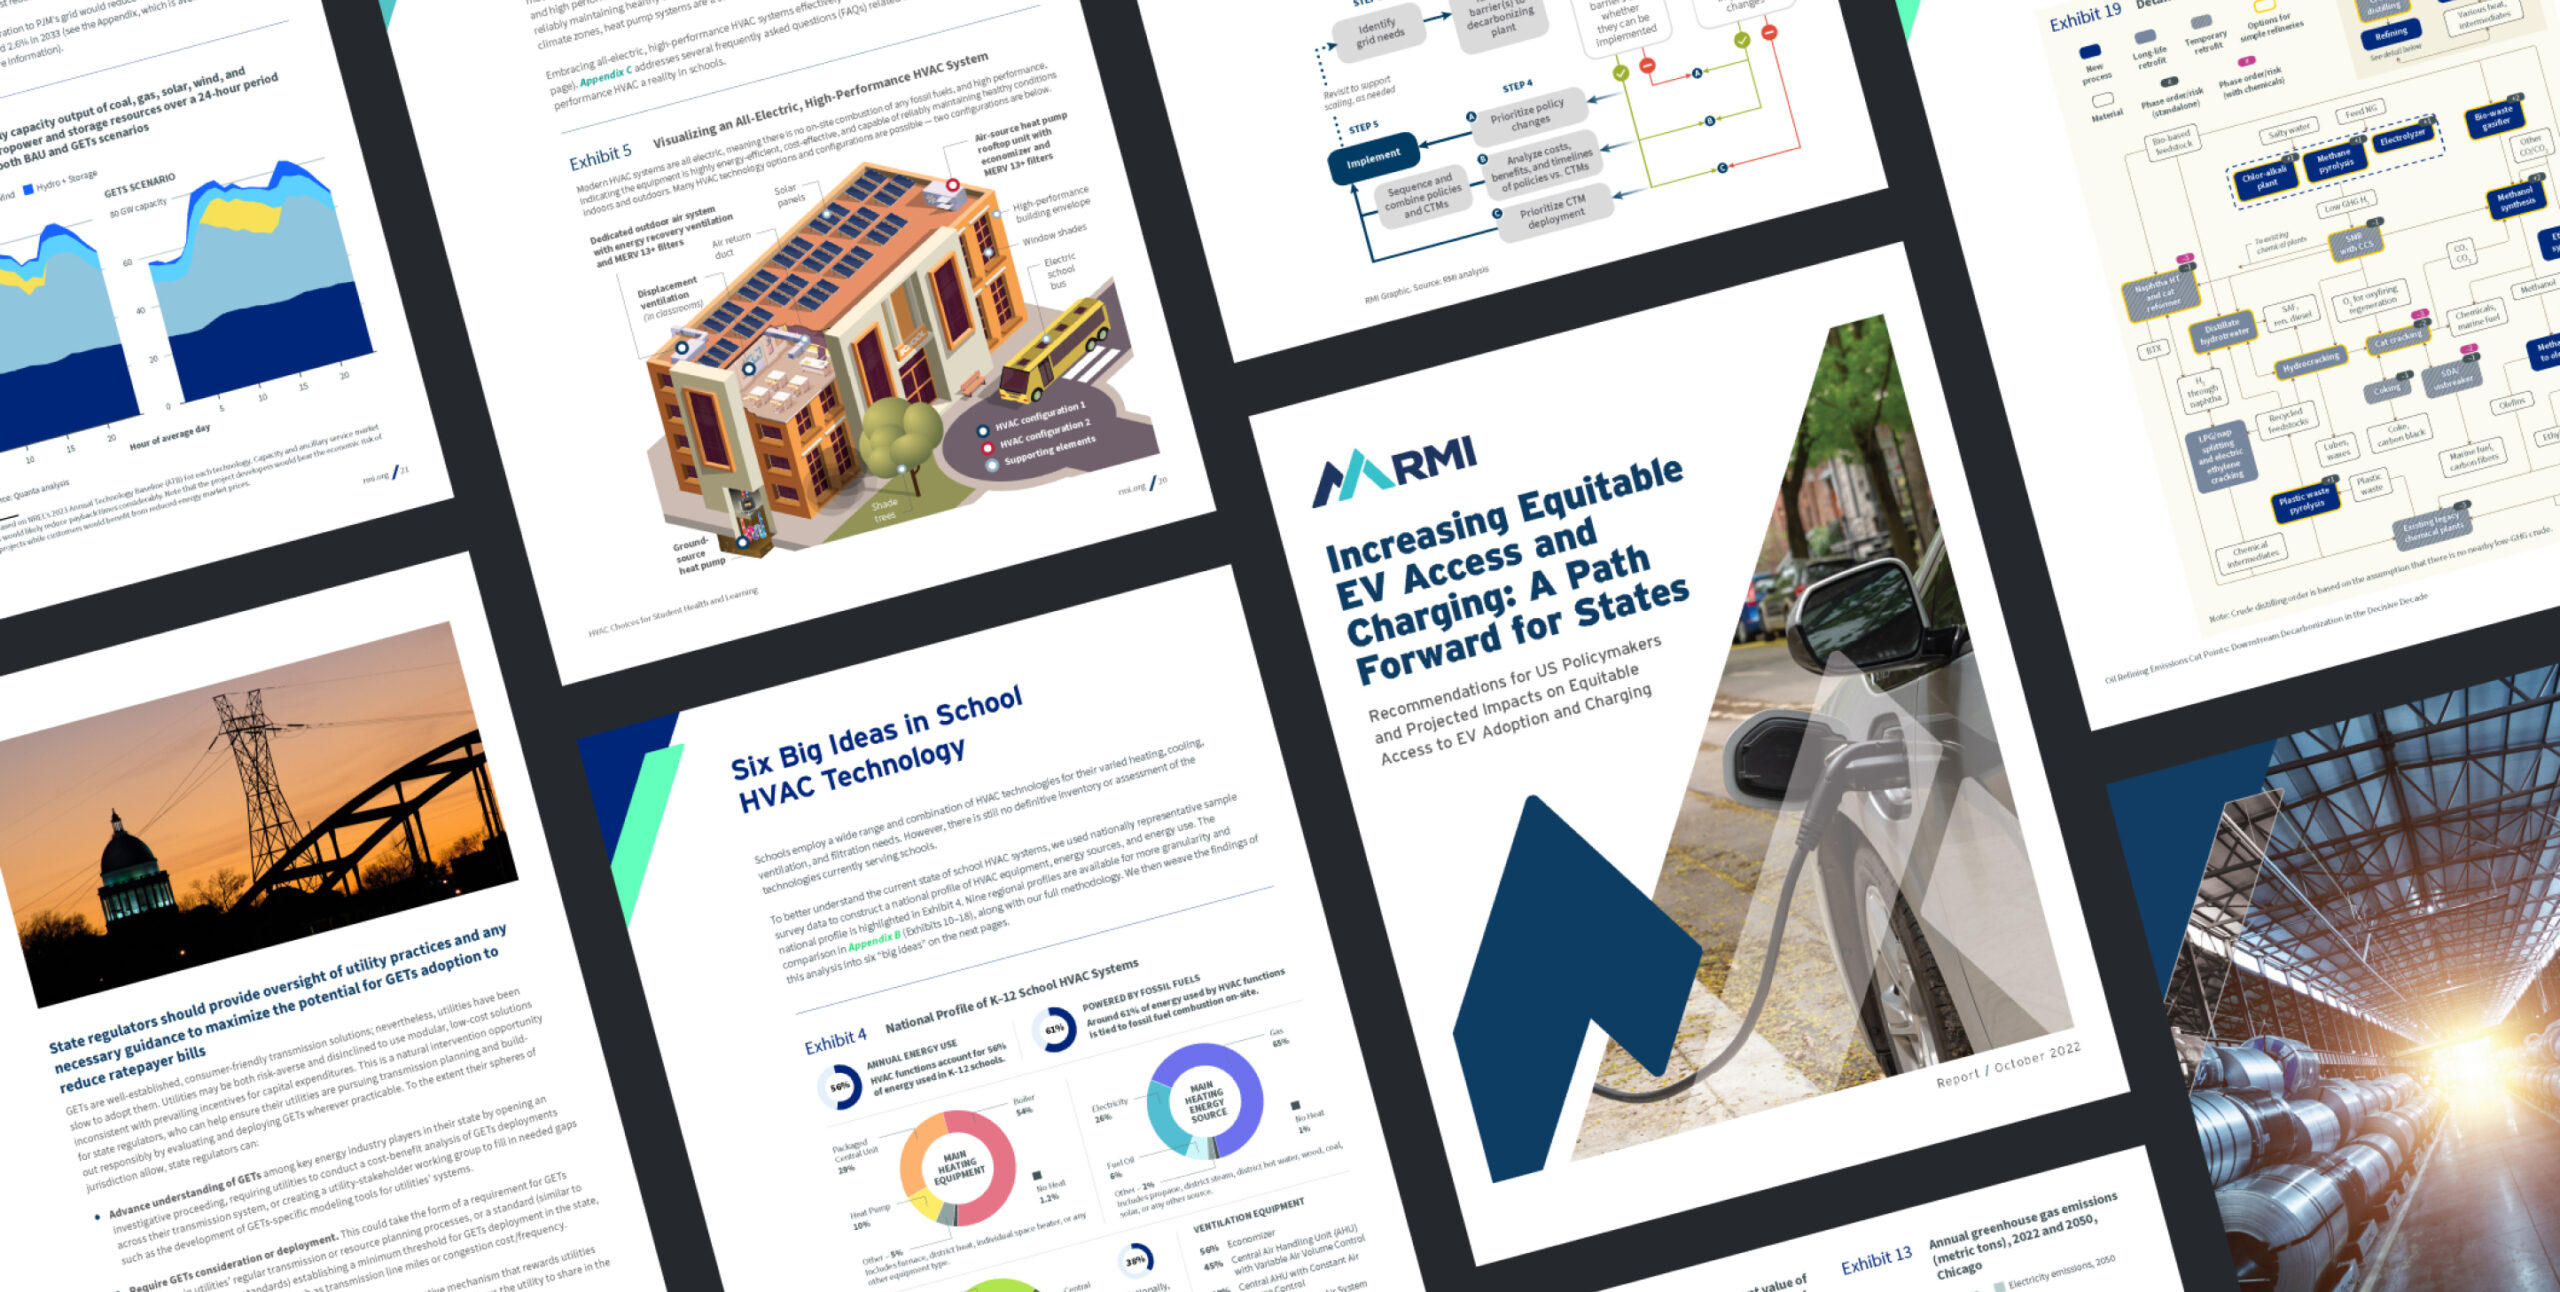
RMI (formerly Rocky Mountain Institute) is a leading voice in energy systems transformation, with deep expertise across buildings, transportation, industry, and finance. Since 2021, MG Strategy + Design has supported RMI’s mission by translating its ambitious research into compelling visual stories—designing more than 40 reports per year across digital and print formats.
In partnership with M. Harris & Co. and RMI’s Creative Operations team, we’ve built a collaborative “mini-newsroom” model to streamline production, sharpen clarity, and elevate the storytelling power of each piece.
Partners
Partnership
Our partnership with RMI is built on creative trust and shared urgency. We work hand-in-hand with researchers, editors, and program leads across RMI’s global offices to bring clarity to their most ambitious ideas.
Together with our partners at M. Harris & Co., we manage the end-to-end editing and design process—from early drafts through publication—ensuring that every report hits the mark in both editing and visual impact.
Strategic Editorial Collaboration
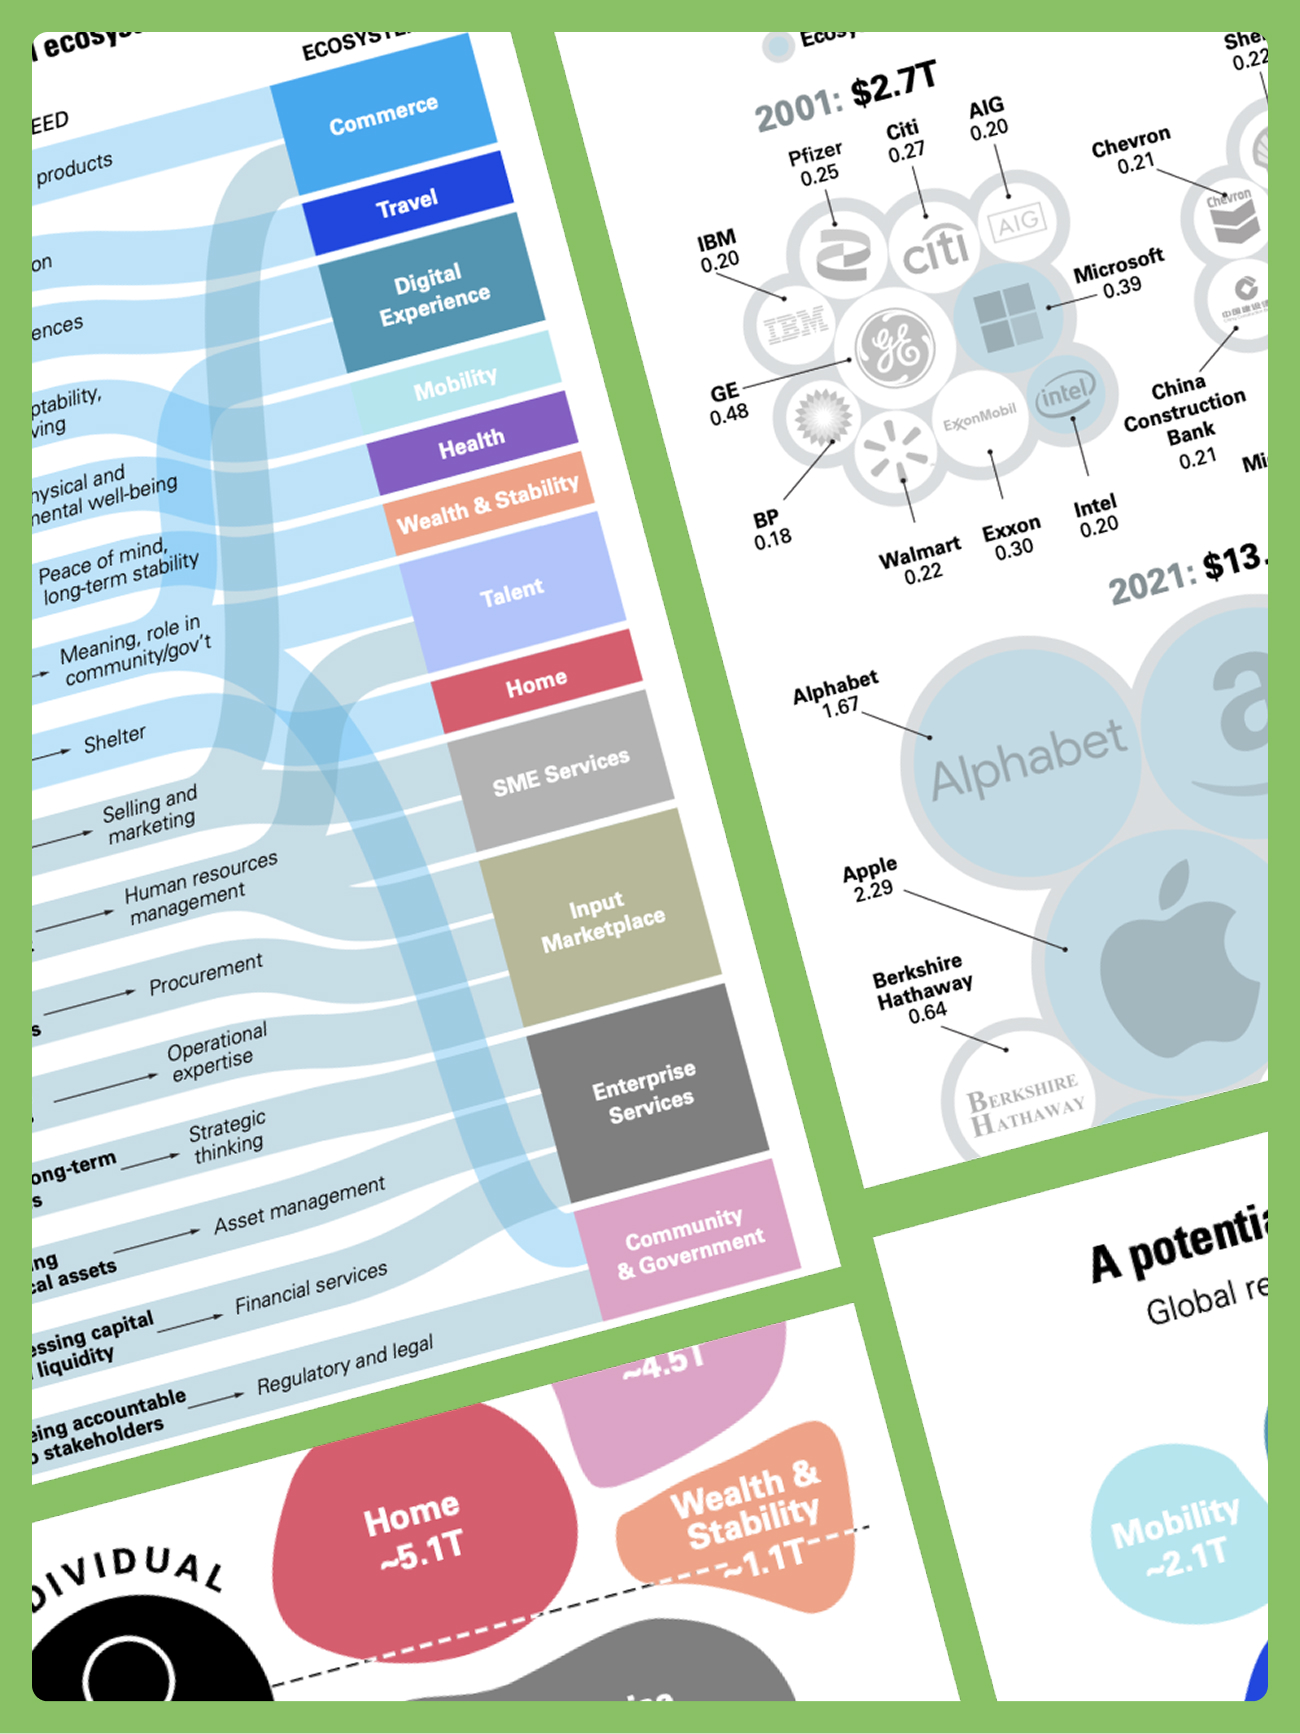
Each project begins with a conversation. Our team helps RMI’s programs to distill complex findings, and identify where design can enhance understanding. From process graphics to impact timelines, our visual strategy is always in service of the insight.
We build clarity into every figure, chart, and page—ensuring RMI’s ideas move quickly from dense research to high-impact storytelling.
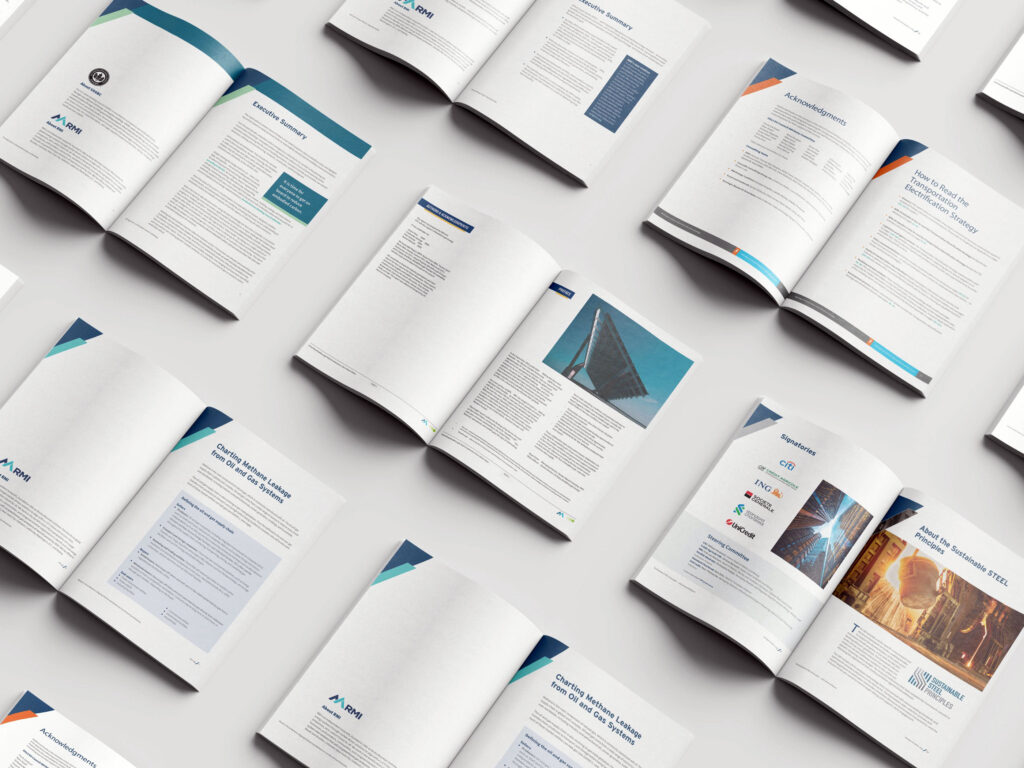
A Visual System, Report by Report
Rather than reinventing the wheel with every document, we helped shape a modular visual system that flexes across RMI’s wide range of outputs:
- Custom templates and layout standards for consistent branding
- Illustration styles and infographic models that scale across programs
- Visual hierarchy rules to guide flow and comprehension
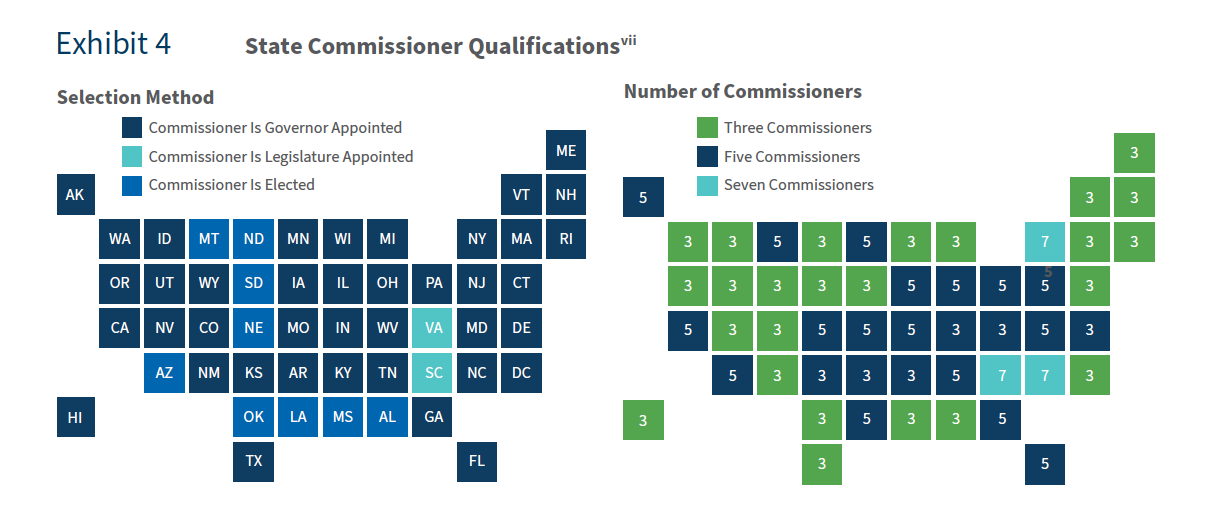
- Reusable components for maps, data visualizations, and callouts
This design system enables fast, collaborative production while still allowing each report to feel distinct and timely.
Interactive Slideshows & Data-Rich Infographics
RMI’s ideas aren’t confined to reports—they often need to live where attention spans are short and clarity is critical. That’s where our slide design work comes in.
We help RMI translate its most technical, high-stakes findings into dynamic presentation decks that travel across boardrooms, conference stages, and stakeholder briefings. Each presentation is built with visual hierarchy, clarity, and modular storytelling in mind—so that every slide adds value, and every sequence builds momentum.
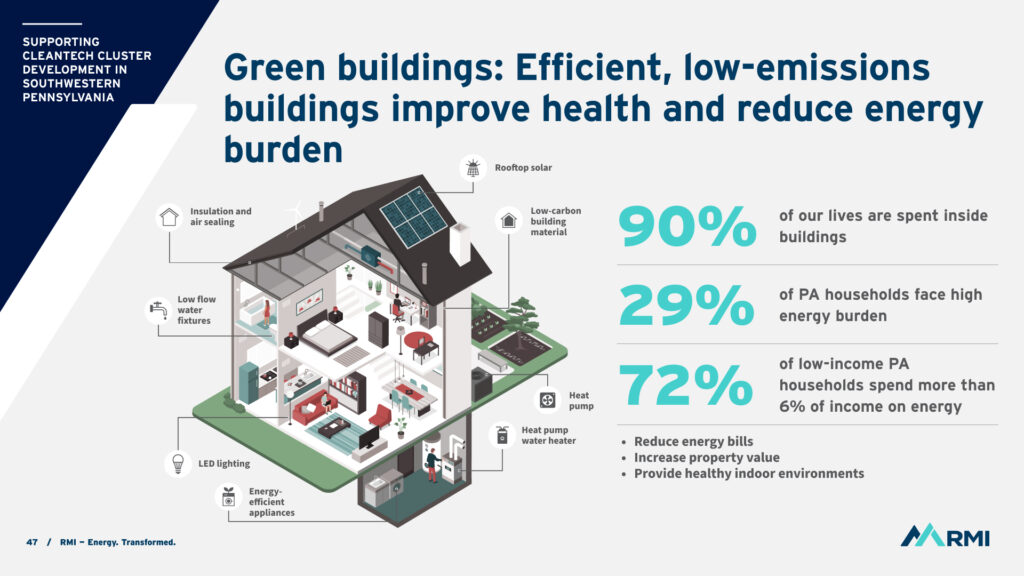
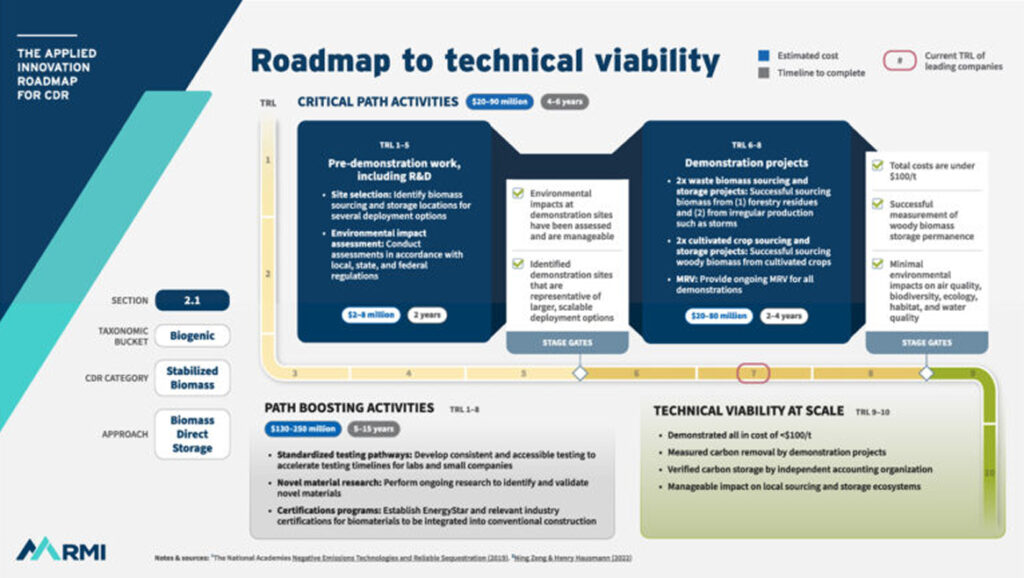
We design infographics that double as slides and stand-alone visuals:
- Exploded diagrams that explain complex systems at a glance
- Policy roadmaps that show pathways through uncertainty
- Quantitative storytelling that anchors abstract strategies in data
We also work with RMI’s internal teams to build editable templates and presentation kits that reflect their brand and scale across dozens of programs. The result is a library of visual assets that inform, persuade, and spark action—on-screen and beyond.

Impact & Recognition
RMI’s research now travels farther and hits harder—thanks to a visual system that informs without overwhelming, and a production model that meets the moment. Our ongoing partnership helps RMI’s communications stay agile, aligned, and deeply effective in advancing a zero-carbon future.
Services
Report Design & Layout
Data Visualization & Infographics
Annual Report Design
Interactive Slide Decks & Presentations
Templates & Visual Systems
Editorial & Production Collaboration